(This blog post was sparked off by reading a post by John Robertson on his blog Talking Up Scotland. His post is from 8 June 2018 and called 8% of the population, nearly 9% of the exports, but only 5.25% of the imports.)
Every quarter Her Majesty’s Revenue men and women calculate the UK’s imports and exports of goods. And rather helpfully, they break the figures into UK geographical areas. These are the latest figures:
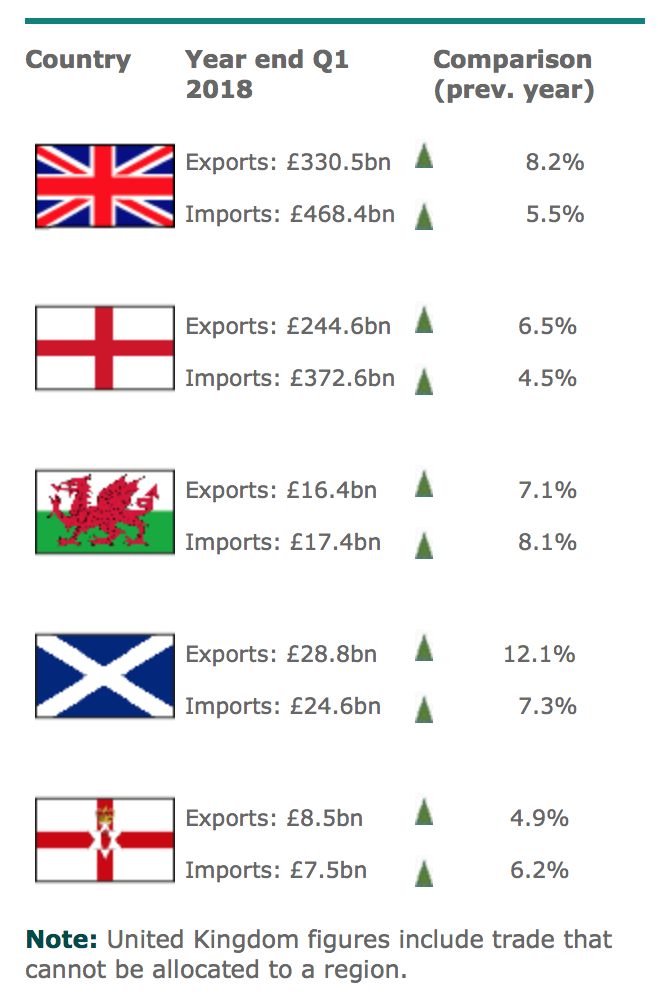
That’s looking pretty good for the non-English parts of the UK. Scotland and N Ireland have a trade surplus in goods and Wales is not far behind with only a modest trade deficit. Engerland however are massively in the red with a £138billion deficit. In fact their imports are 40% more than their imports.
Now I say “their imports”. But is this fair? It could be that the high goods deficit of England actually contains stuff that will make its way to non-England. My BMW was imported from Germany to the south of England so presumably counts as an English import even though it left England a week later and now resides in my front drive in Glasgow. Of course the same could be said of exports and maybe non-English exports are being labelled as English as they are transferred to England and then exported . Basically we don’t know. I think it’s likely that both are happening. There appears to be no way of finding out if and by how much these trade figures hide secondary movement of goods within the UK. Richard Murphy has also delved into this whole area. On imports/exports he writes:
“… what of Scottish imports and exports? Let’s be blunt: no one has a clue what crosses the borders from Scotland to England and Northern Ireland. These numbers are literally made up in that case.”
I think that’s an example of he calls CRAP statistics where CRAP = completely rubbish approximations.
I am not accusing HMRC of deliberate obfuscation of the figures here. HMRC’s analysts are simply taking the data as it’s collected and setting it out in ways that they think are helpful.
Unknowns : Known and Unknown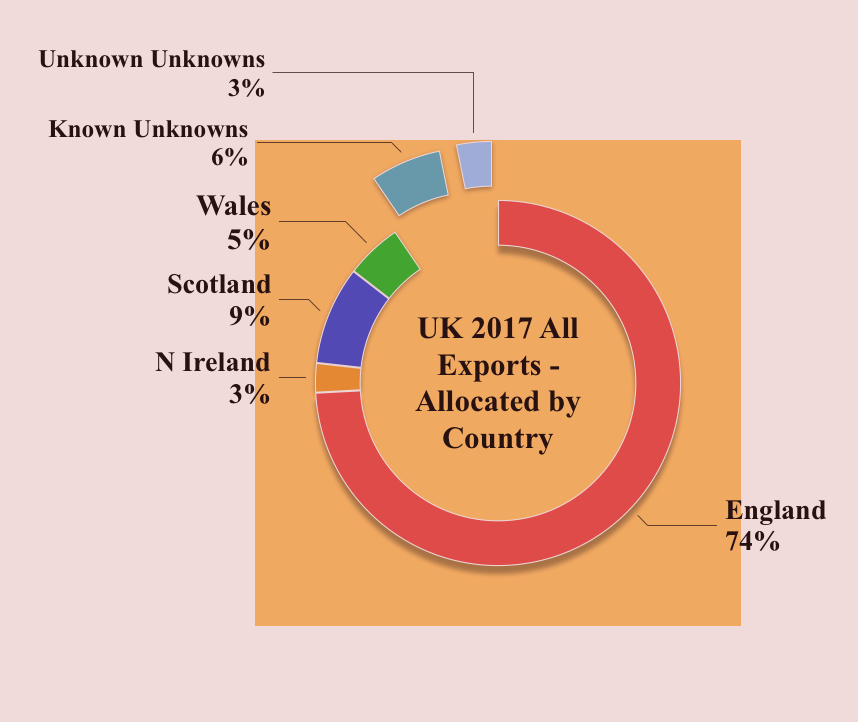
Not all goods can be allocated to a specific geopraphical area. HMRC deals with two kinds of Unknowns : Known Unknowns and Unknown Unknowns. Now this shows considerable aplomb I think. Presumably it’s HMRC-speak for ” Don’t ask us what this is, where it’s come from or where is going, we don’t know!” What’s unknown to me is whether the inclusion of Unknowns makes the rest of the figures more or less likely to be camouflaging the secondary movement of goods. What we do know is that what HMRC say on their trade figure comparison charts : exports which cannot be allocated to a specific geographical area go into the overall UK figures. So this does at least mean that unknowns don’t bolster export figures for specific areas. But they do presumably cause an export underestimate somewhere? I have tried to find a definition of unknowns but can’t. I suppose being indefinable is in its nature. In 2017, these Unknowns accounted for 9% of all exports and imports. But it’s considerably higher than that for some commodities.
If there were a commodity that we know is all produced in Scotland then we could look at HMRC’s data and see how that commodity is reported. Whisky immediately comes to mind. But there isn’t a separate listing for whisky in HMRC database. It’s subsumed under food & drink. There is another possibility though : oil. 96% of UK’s oil production and 60% of it’s gas production comes from Scottish waters. And HMRC list oil and gas under “Mineral Fuels”. Mineral Fuels also includes coal so coal exports need factored in. But even so it seems like it might be a useful exercise to look at HMRC’s data on mineral fuels.
Mineral Fuel Data, HMRC
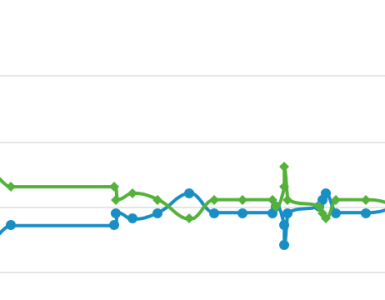
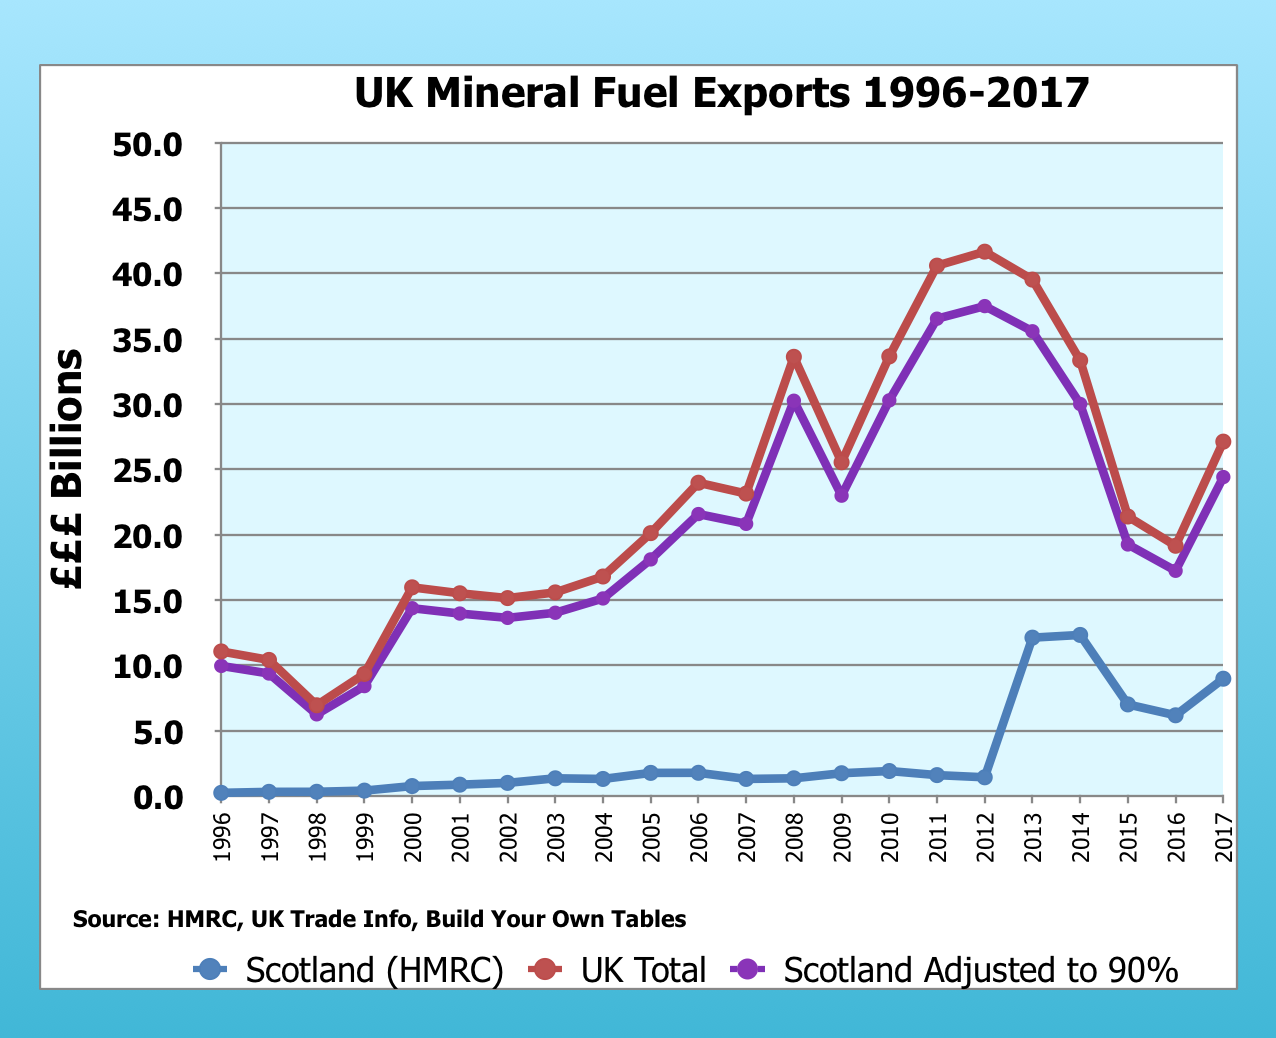
HMRC have a really good interactive website called HMRC Trade Info. And it lets you build your own data tables. So I built a table for the exports of mineral fuel from 1996-2017:
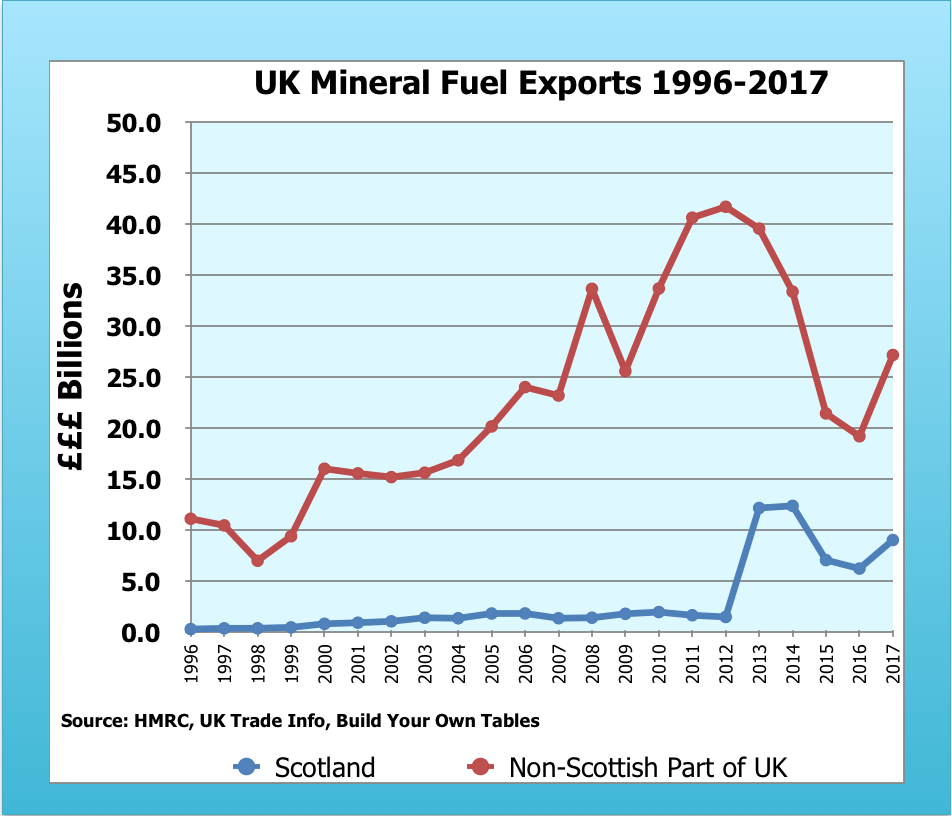
Wow. There’s an eye opener. Most of the UK’s exports of mineral fuels are allocated as being non-Scottish. From 2013 onwards, there is clearly a change in how things are calculated by HMRC. But even so most exports are still not allocated to Scotland. Here is the same data, broken down further:
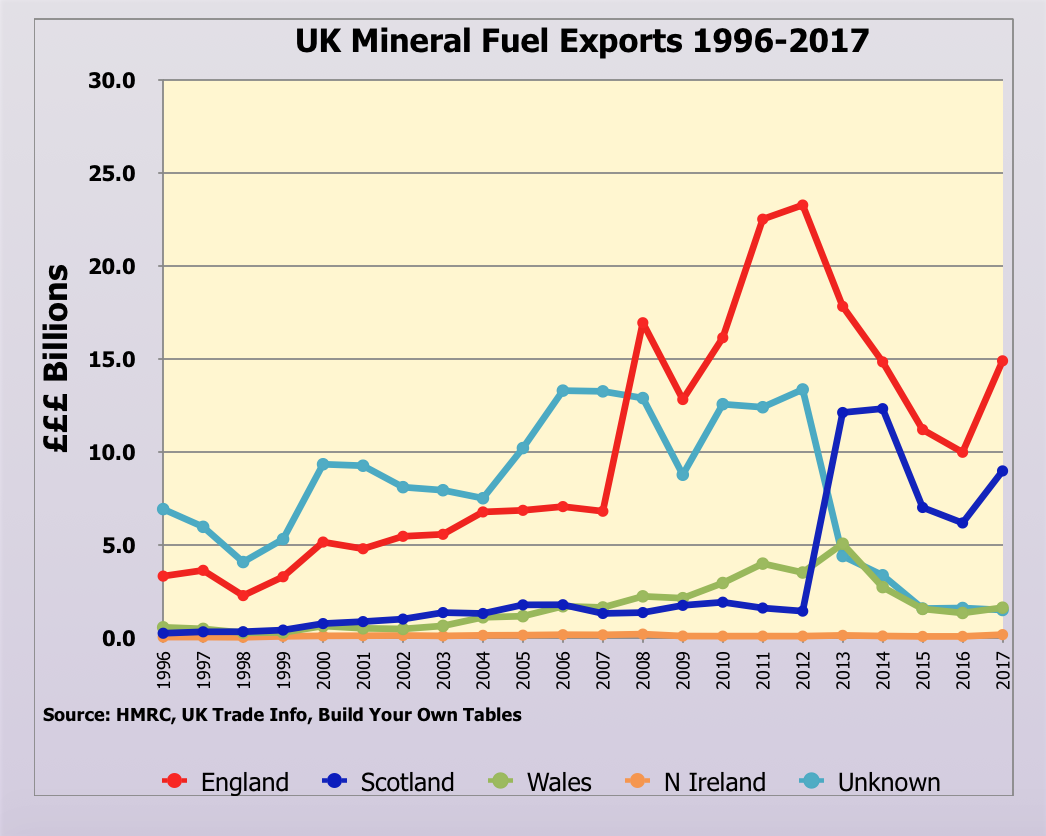
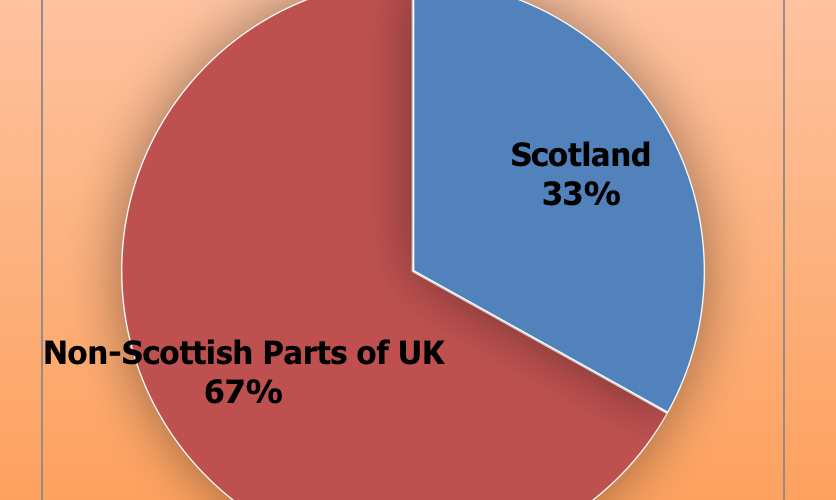
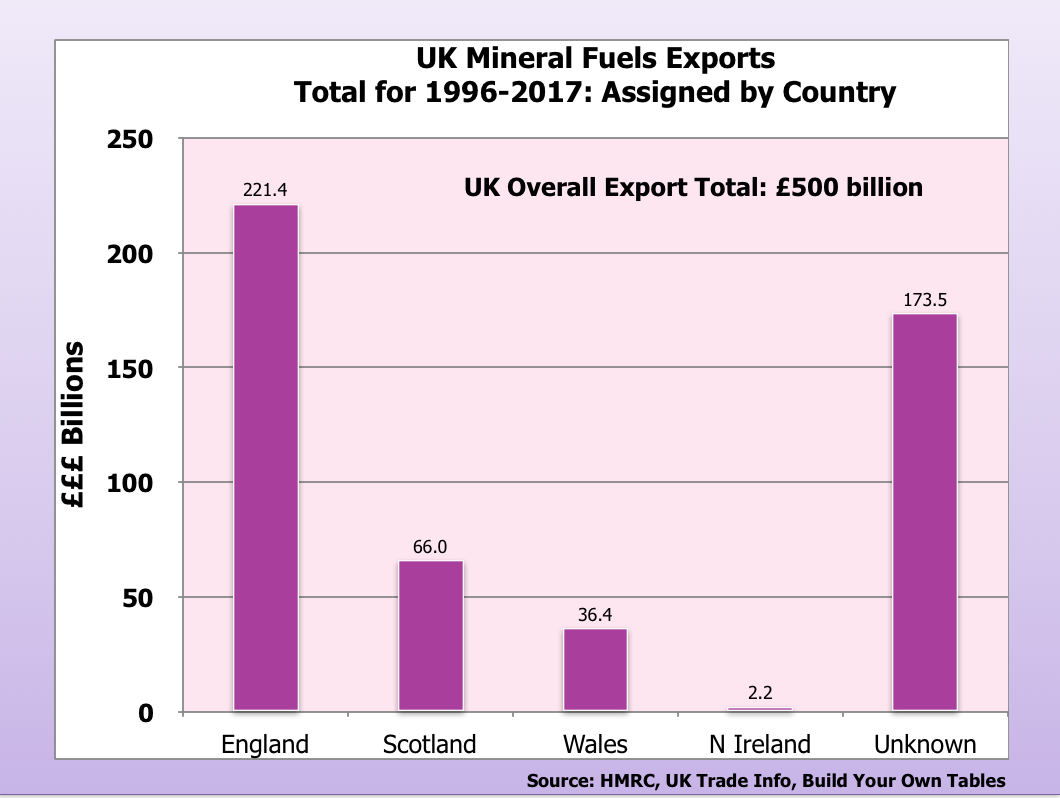
Looks like HMRC have changed the way they dealt with mineral fuel exports in the ‘Unknown’ category. It’s not as straightforward as just reclassifying the hithertofore ‘unknown allocation’ fuel exports to Scottish exports but it does look as if there is quite a big correlation between them. HMRC say on their trade figure comparison charts that exports which cannot be allocated to a specific geographical area go into the overall UK figures only. So it’s not as if these Unknown mineral fuel exports previously bolstered England’s exports. And they sure as hell didn’t boost ours either! Here are the exports of mineral fuels in £billions as recorded by HMRC over the period, 1996-2017. Unknown allocation makes up a third of the total.
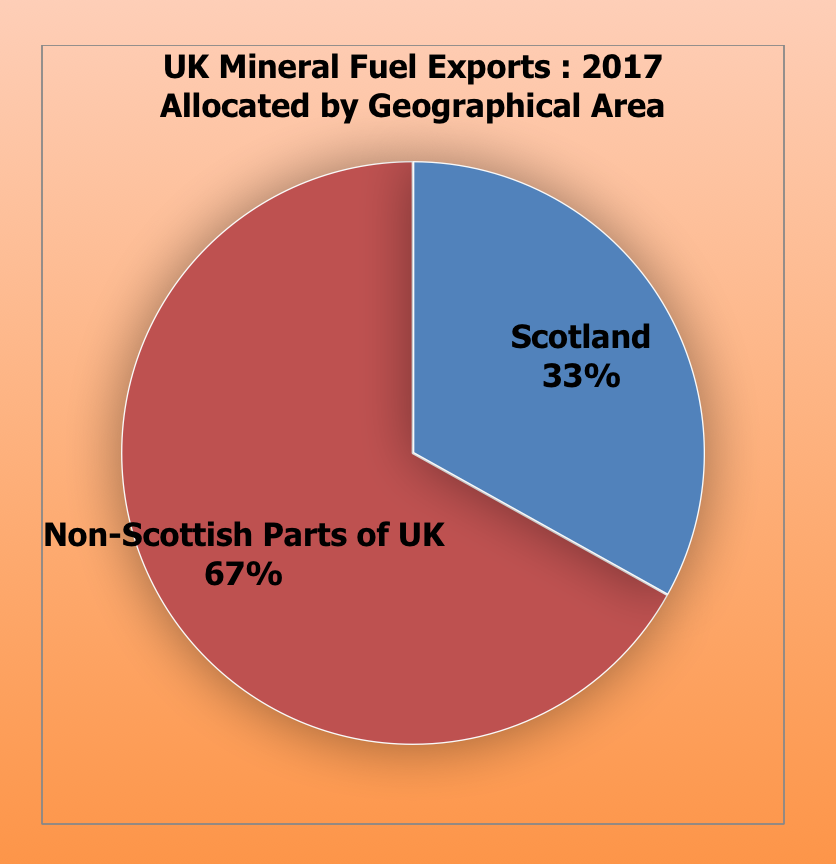
In 2017, the distribution is this:
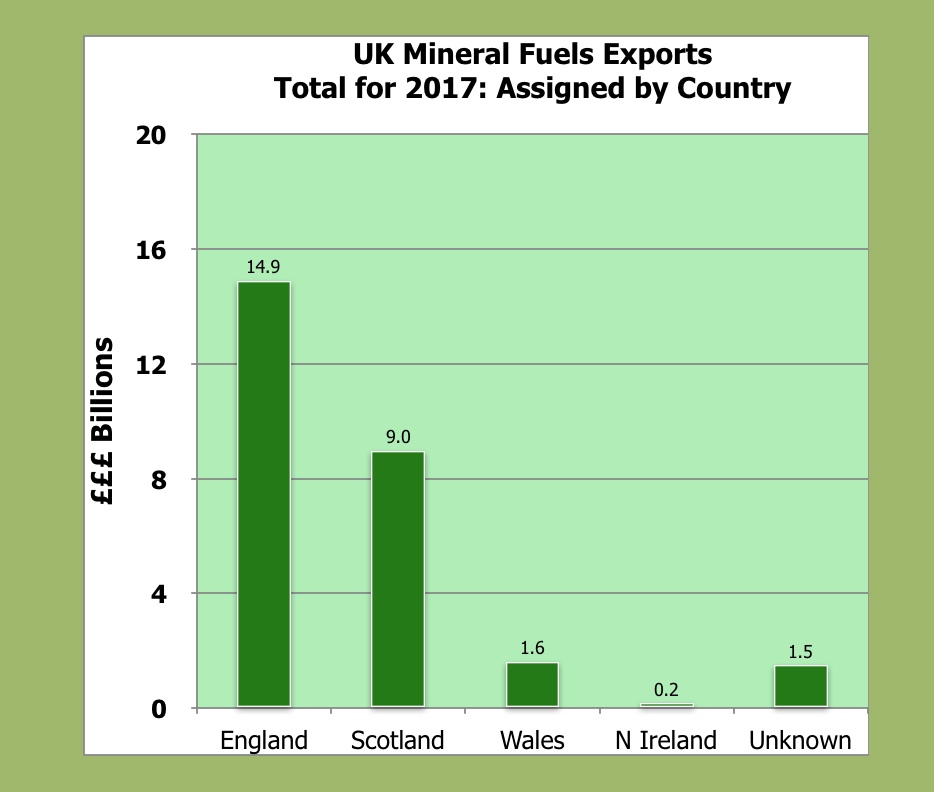
Or to show 2017 fuel exports in another way:
Is there a reasonable explanation for this? Apart from a dastardly Unionist conspiracy involving the UK Treasury and the HMRC ….
First thing is to find out what coal exports look like. UK has gone from being a nett exporter of fossil fuels to being a nett importer. We haven’t been a coal exporter for a long time. So there’s no skewing effect from coal mineral fuel in the HMRC data. This coal data is from Statista.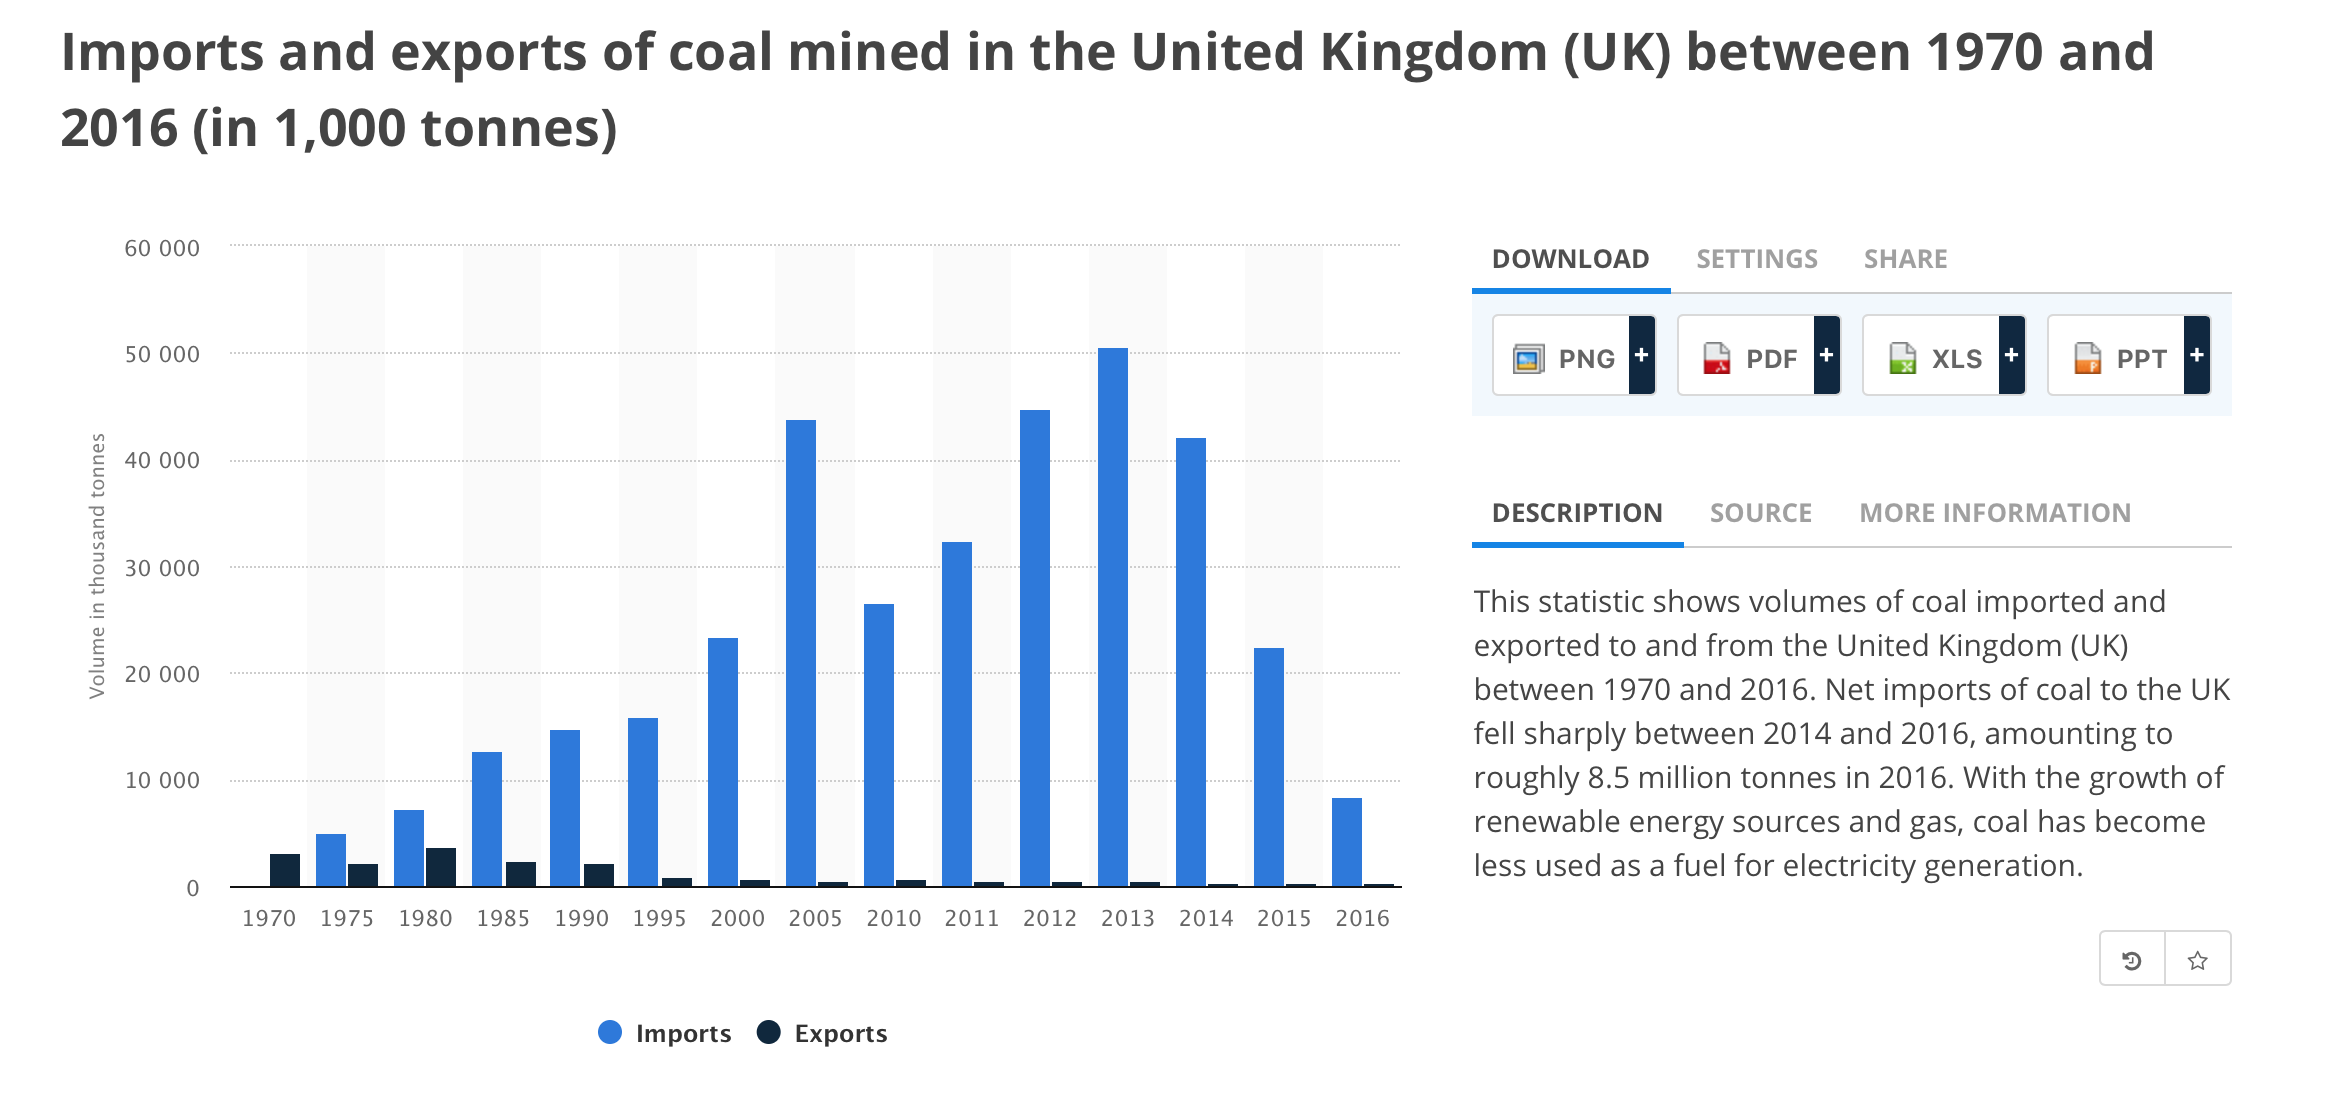
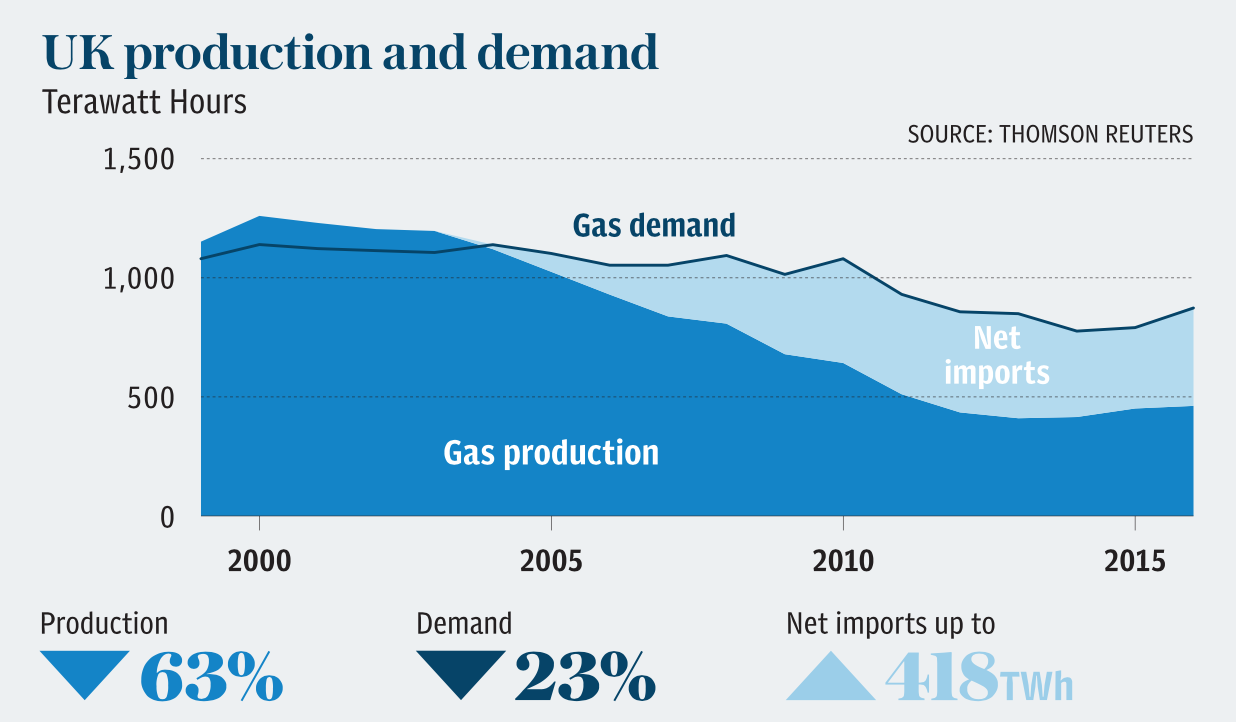
I think it’s much the same with gas. I looked into gas demands in an earlier post called SCOxit: Puttin’ England’s Gas Oan a Peep. Here’s how UK gas demand has changed over time. Well, again I say UK demand but really it’s England’s demand because remember that 60% of gas comes from Scottish waters and that’s more than enough for us with only 8% of the UK population.
My first chart way up at the beginning of this post is not skewed by exports of gas or coal because we don’t export much of them. So I’ve redrawn the chart making the assumption that 90% of UK mineral fuels exports originated from Scottish waters or from the Scottish mainland. The commonly quoted figure is that 96% of North Sea oil is found in Scottish waters but this smaller figure allows for any Unknowns, known or unknown. 😉
The total value of UK mineral fuel exports over 1996-2017 is £500 billion. HMRC data allocates £66 billion to Scotland. I think there’s good reason for thinking that our allocation should be a lot more than that: more like £450 billion. Let’s call it £400 billion over the past twenty years. That’s an average of £20 billion a year export trade.
Let’s make another assumption and say that this export trade was taxed at 20%, that’s revenues of £80 billion over that twenty years, or an average of £4billion a year income to the Scottish Treasury.
How accurate is all this?
- The basic data I’ve used here is taken straight from HMRC’s own database. So these figures are as accurate as the Revenue Men’s data.
- Mineral Fuel is defined as
- A hydrocarbon-based fuel, such as petroleum, coal, or natural gas, derived from living matter of a previous geologic time.
- I’ve said that UK exports of mineral fuels are unlikely to include any coal and very little gas and that is based on date from Statista and from the Department of Energy & Climate Change (DECC).
Conclusion
- We woz robbed! But then we’ve thought that for a long time.
- What’s more infuriating is that we still don’t have a decent way of collecting statistics about Scotland.
- If it shows nothing else, this exercise shows that we need a Scottish Statistics Agency as proposed by Commonweal.
- And none of the above takes into account the movement of goods between the four UK nations. That’s really, really Unknown!