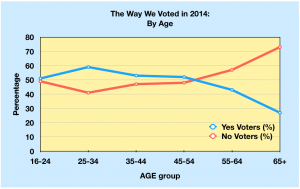
If you’ve read my last post about why we voted the way we did in the 2014 independence referendum, you’ll maybe remember this graph :
These figures were from the Ashcroft poll of 2,000 voters done in the two days after the referendum. My age group, 65+, weren’t convinced, not by a long chalk. Other info from that poll indicates that the main reasons folk voted ‘No’ were about the economy, and about having strong attachment and sense of identity through being British.
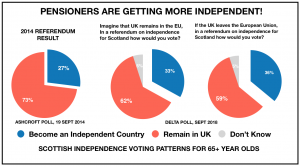
But a recent poll by Delta shows a bit of a shift among that age group. It looks like a shift towards to Yes. And that shift becomes greater when Brexit is factored in. This makes some sense if No voters were people who were worried about the effect of independence on the economy. The British economy is not the safe refuge that Better Together claimed it would be, just today BBC News reported it as being 2.5% lower that it would have been without the Brexit vote. And we haven’t even got a deal yet.
Look –
It’s not simple to compare polls by different pollsters because of differences in their polling methods, but let’s do it anyway. In 2014 only a quarter of pensioners voted Yes. Now, more than a third say they’ll support independence.
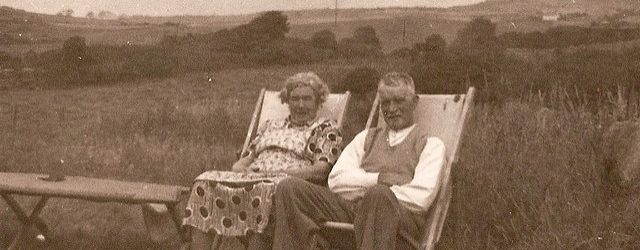
Way to go! Still a fair bit of work to do yet though. That’s my granny and grandad in the header photo. They would have voted yes!!


Add comment